Webinar: Leverage Your Generator Assets To Earn Revenue


Properly permitted, your emergency generation—EG—is both a reliability asset and a revenue generator. EG provides a great opportunity to earn revenue and save on energy costs through demand response (DR) and demand management programs.
The path from emergency generation to revenue generation, though, may seem like a complex, confusing, and occasionally contradictory thicket of state and local environmental regulations. Few organizations fully understand the scope and intricacies of EG regulation, which often results in misinformation, missteps, and missed revenue opportunities.
Fortunately, CPower’s extensive experience and knowledge base has led hundreds of organizations through the jumble of regulations and provided a clear path to monetizing EG assets. This webinar covers everything today’s energy managers and engineers need to to know to maximize the benefits of their EG portfolio. It includes:
- A brief history of emergency generation as a component of demand-side energy management, and the numerous rule changes that have created the current EG landscape
- How existing generators can be upgraded to meet increasingly stringent permitting requirements, bringing previously excluded MWs back into the market
- Success stories illustrating how CPower has helped find and reclaim “lost” megawatts and enroll them in lucrative demand response and demand management programs
Join Ray Berkebile, CPower’s nationally recognized EG permitting expert, and CPower engineer Alison Keefe as they lead this in-depth look at how your EG assets can generate revenue for you, too.
Download the slides: Leverage Your Generator Assets To Earn Revenue Webinar (PDF)
How to Maximize Demand Response Earnings with California’s DRAM Program


For most of the last two decades, demand response in California has been largely procured and operated by the state’s electric utilities.
That trend is changing.
Demand response in California is currently experiencing significant changes as regulators implement measures to expand the state’s pool of energy resources and assimilate these resources with the California Independent System Operator’s (CAISO) markets.
This regulatory reform has created new opportunities in California for demand response programs, which pay businesses for using less energy when the grid is stressed or electricity prices are high.
The Demand Response Auction Mechanism
The Demand Response Auction Mechanism (DRAM) was developed in 2014 under the guidance of the California Public Utility Commission (CPUC) in an effort to harmonize utility-based reliability demand response with CAISO, the state’s grid operator.
In December 2014, the Commission issued D. 14-12-024 which requires the state’s IOUs: Southern California Edison Company (SCE), San Diego Gas & Electric Company (SDG&E) and Pacific Gas and Electric Company (PG&E) to design and implement Demand Response Auction Mechanism (DRAM) pilot programs in 2015 for 2016 capacity (DRAM I or 2015 DRAM) and in 2016 for 2017 capacity (DRAM II or 2017 DRAM). The three utilities recently completed a solicitation for 2018/2019 capacity (DRAM III) procuring over 200 MW of DR resources across the state.
Now in its third year, the program seeks to allow CAISO to add reliable demand response resources to areas of California where electric reliability may be at risk.
DRAM is a pay-as-bid program with three goals:
1)Fully integrate DR resources with the CAISO energy market
2) Test whether third parties can bring these resources to the table without structured utility programs
3) Allow residential resources to participate directly in the CAISO markets
The DRAM program also provides market participation testing from a broader base of distributed energy resources, including behind-the-meter storage. Under DRAM, these resources have the opportunity to behave not just as system capacity, but also as local and flexible resources.
California’s recent actions aim to revise the market’s existing demand response program structure and are an indication that DR has an important role to play in the state’s future.
The best way for an organization to take advantage of the DRAM program and the opportunities available in the California Market is to consult a trusted demand-side energy management company.
Such a company can evaluate an organization’s facilities and determine its curtailment capabilities. Next, they can explain in full the many demand response and demand management programs that are available in the California Market and help determine which offer the particular organization the best chance for curtailment success.
To learn more about how CPower can help your organization earn with the Demand Response Auction Mechanism program, please visit CPowerEnergy.com/dram-california.
To continue learning about how the California grid is changing to meet the needs of the future, read: The Evolution of The California Energy Market: How Demand Response and Demand Management will Play Integral Roles in The Golden State’s Energy Future
Understanding kW vs kWh (and Meter Data) to Lower Your Utility Bills

Many customers as well as my colleagues at CPower often ask me about the benefits of installing reliable metering equipment to access energy data in near real time. I typically respond with a handful of advantages (some listed below), but even before going there I find it useful to explain the full context about why these are important.
No discussion on the topic would be complete without a basic understanding of Demand (measured in kilowatts or kW) versus Consumption (measured in kilowatt hours or kWh). This is key to making the right choices when it comes to reducing energy costs, since electricity use for a commercial/industrial customer is typically billed and metered after taking at least these factors into consideration:
- Maximum kilowatt use (or kW demand) during a given period, typically in 15- or 30-minute intervals, and
- Total cumulative consumption (in kWh).
So, what’s the big deal between kW vs kWh?
An analogy using traditional light bulbs can help: Consider a single 100W bulb lit for ten hours versus ten 100W bulbs lit simultaneously for one hour. In both scenarios, the total cumulative “consumption” is 1,000 watt-hours (or 1 kWh). In the first case, however, the single light bulb will “demand” 100W or 0.1 kW from the electric supplier. Thus, the utility must have that 0.1 kW ready whenever that bulb is switched on. But note how the second scenario impacts the utility from a “demand” perspective. The electric supplier in this case must be ready to deliver 10x as much ‘capacity’ in response to the demand of the 10 light bulbs burning simultaneously!
Quite simply, here’s the difference. If these two scenarios reflected the behavior of two different customers, and if they were each billed for only their consumption, then both would get the same bill (for 1 kWh of energy used) even though the burden placed on the utility to meet each customer’s energy requirement is very different. Among other reasons, this is primarily why C&I (as opposed to residential) customers are typically metered and billed based on both their hourly “consumption” patterns and their peak “demand” for energy.
Demand-side energy management in near real time
CPower’s savvy demand response (DR) customers effectively leverage the energy they consume as a facility asset. Our diverse customer base covers mid- to large-sized electricity users in commercial, industrial, government and institutional organizations, including water/wastewater pumping and treatment facilities, colleges and universities, public agencies, office campuses, cold storage, data centers and a wide range of manufacturing facilities, to name just a few.
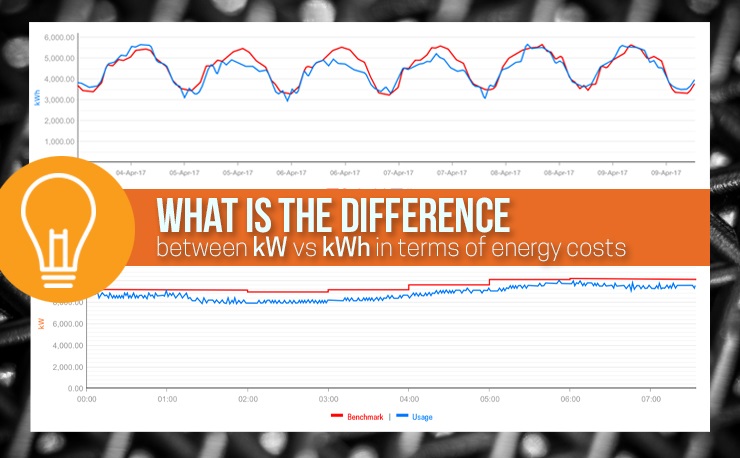
Many of our most active DR participants nationwide additionally leverage real-time metering for its clear advantages, including more visibility and control over load reductions as well as better overall energy management and sustainability benefits. The image above shows just two of the many views available to users via the CPower App (the graph on top shows 7-day hourly interval consumption while the one below shows demand on an intra-day 1-minute interval chart).
Key reasons to get real-time metering installed at your facility:
- You can identify unusual or erratic equipment behavior to help avoid catastrophic failure. This is from a recent real-world example: Our team at CPower was working with the operations team for a large commercial real estate and property management firm, and picked up on unusual/erratic daytime usage patterns at one of their facilities. A look at the major systems of the building revealed that a chiller which had been recently serviced was to blame. Further investigation revealed that during a recent service call the chiller had been severely over-charged with refrigerant. Having a near real-time window into their energy usage enabled the facilities personnel to identify the unusual usage pattern, and proactively remedy a potential chiller issue that could have resulted in thousands of dollars in repair costs and possibly escalated their demand charges had it gone unnoticed.
- Similarly, you may discover unusual, wasteful patterns or aberrations in overall facility energy usage as well as specific areas (e.g., an BAS reset inadvertently switches on all lights in an unoccupied underground parking garage at 2 AM).
- Simplify on-site event planning (e.g., for K-12 schools or colleges) and/or production line scheduling (for manufacturing) with day-ahead pricing and forecasting at your fingertips.
- Quickly and accurately substantiate the impact of your energy efficiency initiatives and sustainability programs (and share results with your team and management).
- Avoid setting a new annual or monthly consumption peak, enabling you to manage demand charges for next year. Click to see more on Peak Demand Management in New England and Texas, for example.
- Immediately evaluate the efficacy of (and fine tune as needed) new load curtailment strategies.
- Further leverage your building automation systems and curtailment planning while minimizing impact on occupants (students, staff, employees, tenants, etc.).
- Facilitate optimized participation in multiple DR programs, including Emergency Capacity, Economic DR, Ancillary Services, and more.
- In addition to monitoring real-time utility load, several customers (i.e. a manufacturer of water valves and a supplier of military components) also view sub-meter data in the CPower App to provide them with a more granular, process-level picture of the energy usage in their facility.
The Bottom line
Real-time metering ultimately increases your DR earnings and savings to fund additional efficiency initiatives, while complementing your facility’s energy conservation and sustainability efforts. There are no out-of-pocket costs, since fees to install hardware, support software provisioning and enable data measurement & verification (M&V) are typically covered by DR program earnings.
By giving you near real-time visibility and analytics of your energy consumption, enhanced metering techniques provide more earnings and savings via greater control over your DR participation and greater awareness of electricity usage patterns (remember kW vs kWh!)