The Truth About PJM’s Pricing Models


PJM and the National Weather Service have at least this in common. Both create model simulations to give insight into what might happen in the future.
If you’ve ever been in the path of a hurricane, you’ve probably spent some time deciphering spaghetti models–computer-generated simulations that predict a storm’s trajectory.
These simulations offer a range of possibilities for where a given storm might land so the public can make informed decisions about how to respond.
PJM, it turns out, creates similar models offering a range for future pricing in its ancillary services market. These models, however, are not publicly available.
That’s where the problem of misleading information in the marketplace begins.
If we look at any spaghetti model tracking a storm path, we’ll likely see a single predictive strand that lies well outside the pack of probabilities–an outlier that is highly unlikely to occur but is still within the realm of possibility.
PJM’s pricing models have their outliers, too–a single, far-from-the-mean prediction that may seem attractive to market participants because of its favorable price tag.
Like most things in the regulatory arena of the energy industry, however, the truth isn’t as simple as the spaghetti model analogy might suggest.
Let’s look at a real pricing model PJM recently submitted to the Federal Energy Regulatory Commission (FERC) as part of a proposal to change its Operating Reserves, which would place a premium on Synchronous Reserves (SR) per FERC’s direction.
In its synchronous reserve pricing simulation, PJM ran a model, changing one element of the data. They then ran a 2nd model changing a different element of data. Both elements are changed as a result of the design changes, but neither model had the ability to capture both changes.
In PJM’s Case C (the highest price noted in the chart below) the key factor was the inclusion of an increased cost driver called the Operating Reserve Demand Curve (ORDC) which showed higher prices. Case B included just the effects of eliminating Tier 1 SR and then re-dispatching more efficiently. PJM explains the difference between these two cases is a more accurate indication leading to the $46k value (the middle row of the chart below).
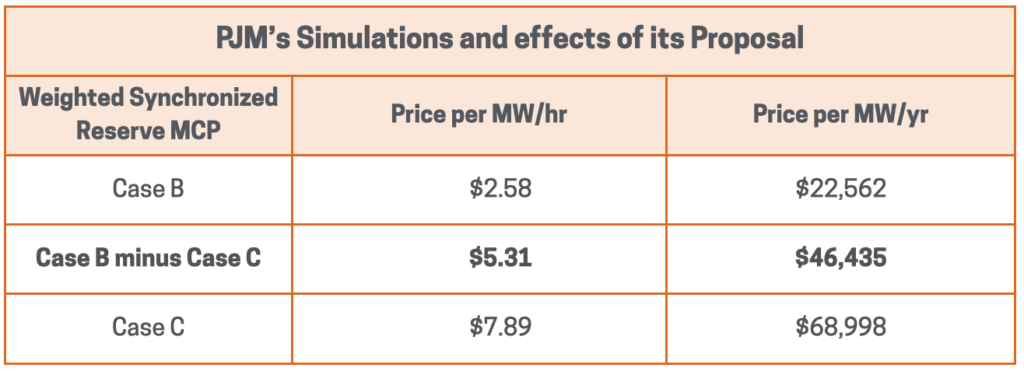
One of the simulations–Case C in the chart, an outlier that PJM notes does NOT account for certain offsetting factors–indicates an average SR price of $7.89/MWhr or about $69,000/MWyr could occur as a result of the changes FERC has approved to PJM’s Operating Reserves.
In this case, the higher pricing model might seem attractive to potential participants in the PJM’s Synchronous Reserves Program. Will this outlier come true?
Not likely according to PJM. Here’s additional information why.
While PJM’s market changes WILL increase revenue potential in the SR market, the actual increase is uncertain. Faced with that uncertainty of outcome, it’s not terribly scientific (or wise) to assess the data and assume the extreme is destined to come true.
The chart below offers a history of recent actual SR pricing and a prediction CPower has made and is actively sharing with our customers.
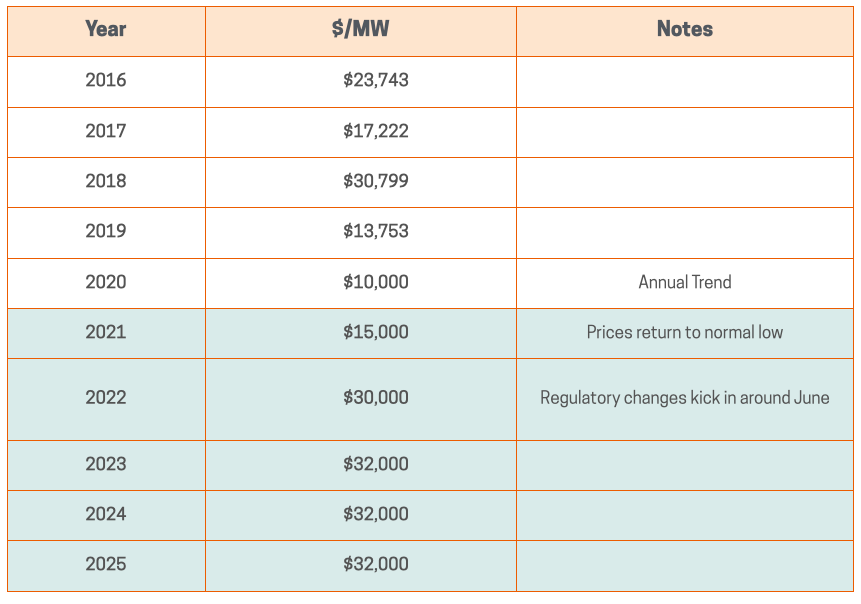
(Note: these or any predictions should not be considered guarantees of revenue.)
Committing assets in an energy portfolio believing PJM’s outlier pricing prediction will prove true is akin to making a storm plan based solely on the lone string of spaghetti that predicts the hurricane will land in a different time zone from yours.
You’re betting on the extreme.
PJM’s SR market is poised to become more valuable in the wake of recent changes. Time will tell where prices actually land, but it’s important for participants to know the odds before they predict the score.